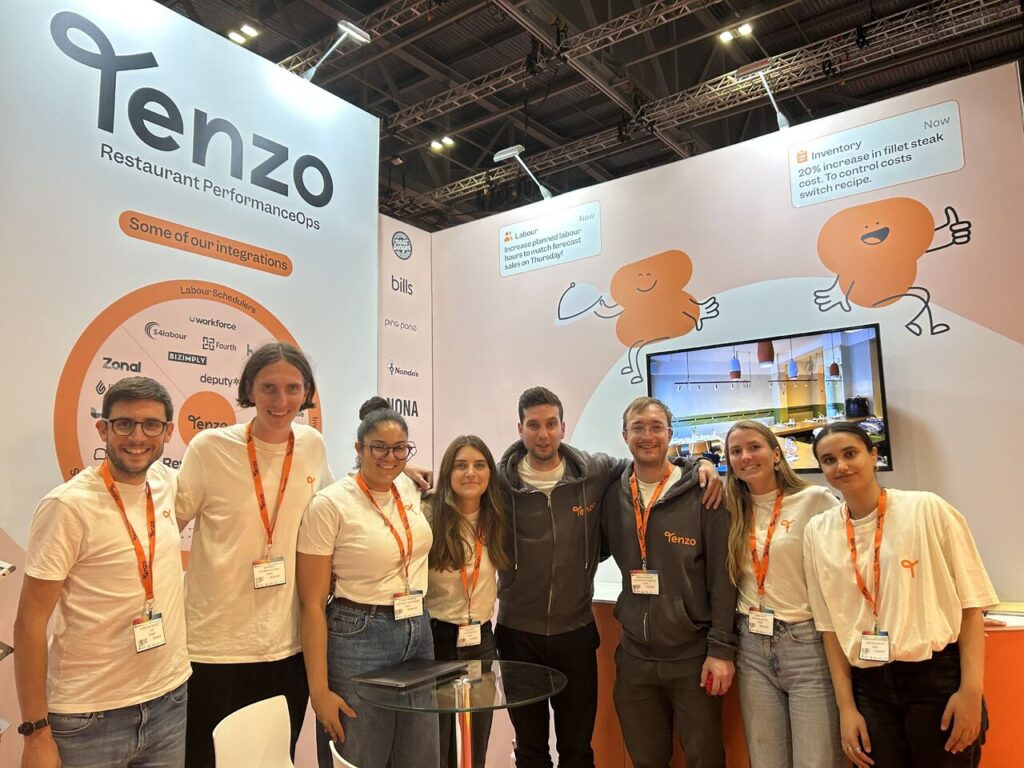
2023 has been one hell of a year at Tenzo! From completely changing the look and feel of Tenzo to growing the team and adding some epic customers, 2023 might have been the best year yet. Introducing Restaurant PerformanceOps The biggest launch of the year (in our world at least). After years of work, we […]
The post Tenzo Wrapped: A 2023 to Remember! appeared first on Tenzo.
]]>2023 has been one hell of a year at Tenzo! From completely changing the look and feel of Tenzo to growing the team and adding some epic customers, 2023 might have been the best year yet.
Introducing Restaurant PerformanceOps
The biggest launch of the year (in our world at least). After years of work, we finally launched our brand new category: Restaurant PerformanceOps together with a full rebrand of our platform.
When Tenzo started in 2016, our goal was simply to bring a restaurant’s data into one place. But as we’ve grown and the industry has become more and more tech-forward, Tenzo’s capabilities have developed to a point where we’re now not only aggregating the data but providing a platform to analyse trends and predict what’s happening next in order to act with confidence and make data-backed decisions, so needed to find the right way to express that.
To hear more about the process of creating our category as well as how we hope to impact the hospitality industry, have a listen to Christian’s interviews on the B Word and Tech on Toast podcasts!
Our goal now is to keep supporting the hospitality industry to shift from surviving to thriving with access to the insights businesses need to keep growing!
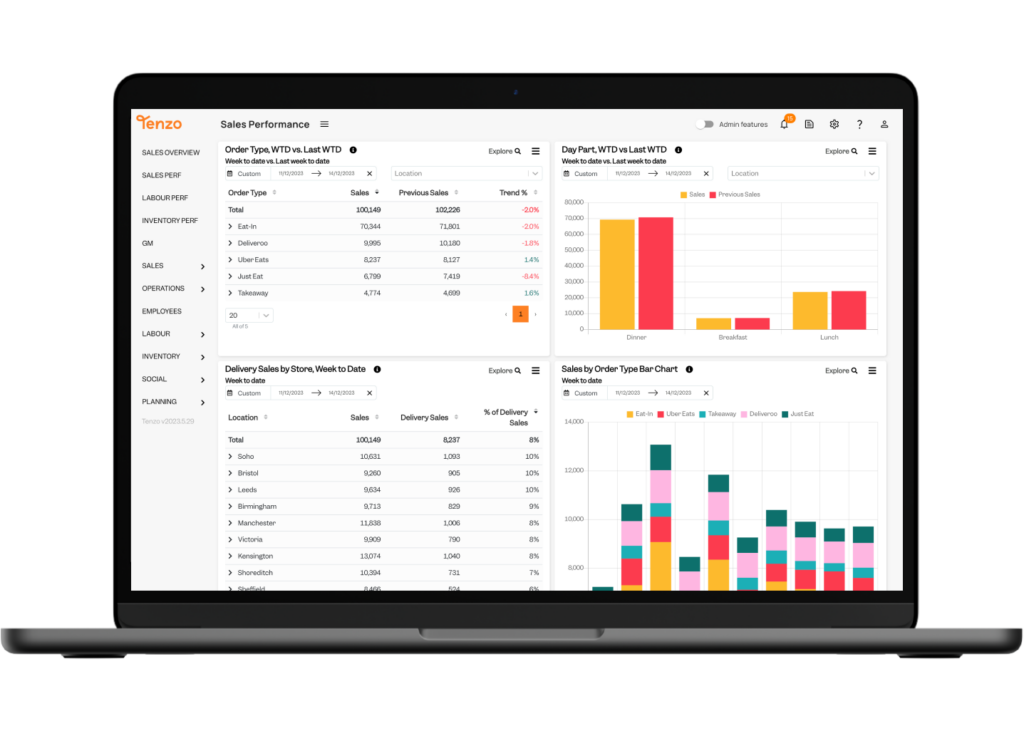
An ever-improving product
Tenzo users will have noticed quite a lot of change in the last year. Firstly, when we launched Restaurant PerformanceOps, we also split our offering into three categories: Aggregate, Analyse & Predict, and Act.
Our Aggregate Product is now available as an independent offering. This means that if a business wants to use Tenzo as a data warehouse where we take care of maintaining integrations to your operational tools but push the data into another BI tool, we can make it happen.
This works particularly well in businesses where head office users are well versed in data manipulation and visualisation and who want very customised ways of looking at their data. A positive is that they can also have access to the Tenzo platform to give their frontline teams a simple, mobile-first way to engage with their data.
On the Analyse & Predict side, we’ve improved our forecasting algorithm and added the option for customers to upload custom calendars to pull in events that are most impactful to their revenue. For example, we now have sports bar customers who pull in all the important matches to help forecast the amount of staff they’ll need so no customers have to miss important moments while queuing for a beer.
We’ve also completely rethought our admin structure and continue to give users more freedom to create their own subscription emails and set up personalised log book templates.
Continuing to be a trusted partner
This year we increased the number of systems we integrate with to over 80 and deepened our partnerships with the companies behind them.
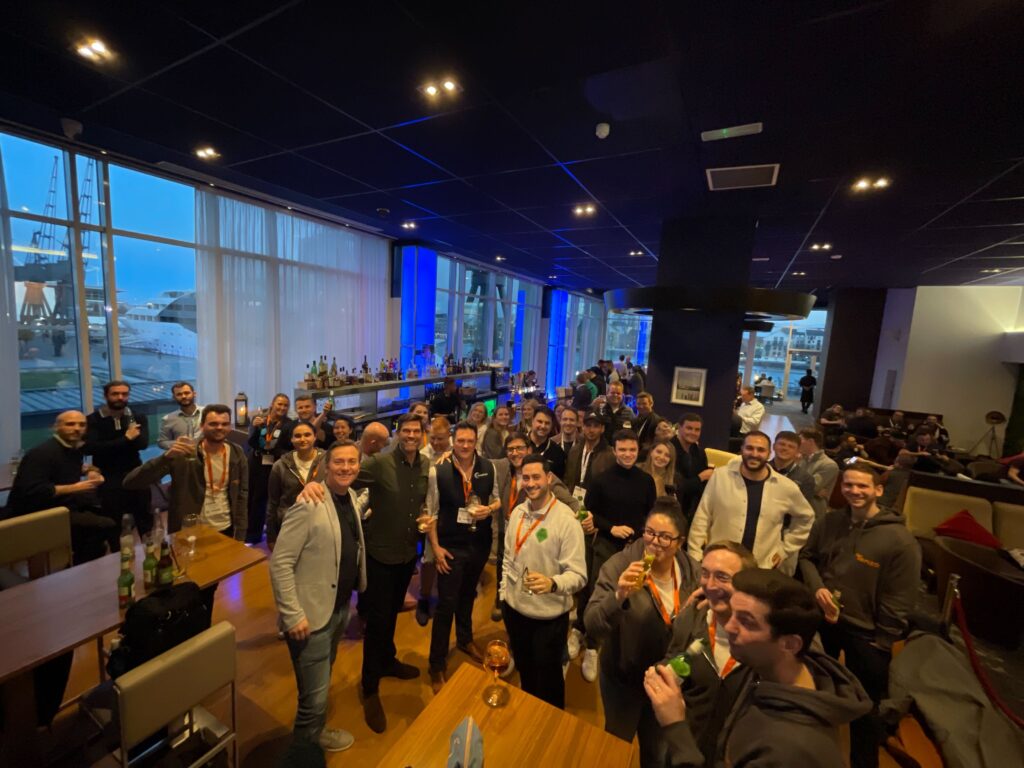
We had over 60 partner events whether that was training, sales enablement, drinks, networking or even the odd football match! Every time we meet with partners, we realise how integral our collaboration is to making sure every shared customer is supported in the best possible way.
We were also delighted to attend the Lightspeed Partner Summit in Montreal this year where we were nominated for the Most Innovative Hospitality Partner Award.
We added a few more integrations to the wheel in 2023 including:
- Oracle Simphony
- Oracle Opera
- Procure Wizard
- OpenTable
- HR Duo
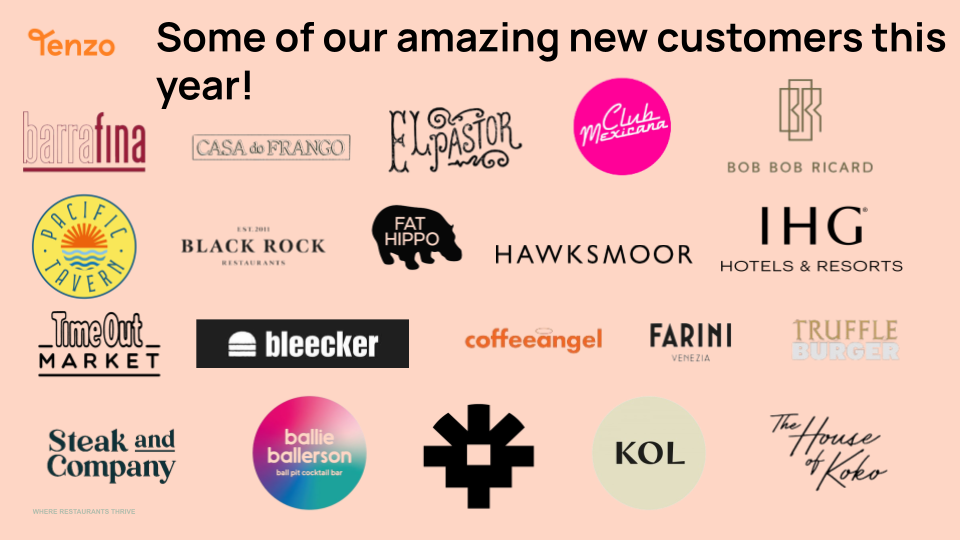
Adding some awesome new customers
Thank you to every single one of our customers who used Tenzo this year! We’re extremely proud to have maintained our 100% 5-star review rate on Trustpilot. A quick shout-out to all the new customers who joined this year! We added three new countries: Germany, Indonesia and South Africa. That brings the number of countries Tenzo is present in to 24!
Here’s just a selection of some of the incredible brands we get to work with on a daily basis!
What’s next?
2024 is going to be epic! We have some amazing features in the pipeline. Keep an eye out for a dashboard creator which will allow users to create their own Tenzo dashboards as well as a card wizard that will help you find the reports you need to add to those dashboards.
We’re revamping emails and alerts so get ready for some awesome new notifications!
There’s even more coming, but you’ll have to wait for 2024 to find out about those secret initiatives. We’re super excited about how we can supercharge Tenzo even further.
The post Tenzo Wrapped: A 2023 to Remember! appeared first on Tenzo.
]]>Figuring out how to price your restaurant’s menu may seem simple at first, but when you factor in spiralling costs, inflation and consumer outlook, pricing strategy becomes a real challenge. Tenzo recently produced a report looking at how much prices have risen in the last twelve months, and while the overall price increases averaged out […]
The post The Art of Pricing in Restaurants: Unveiling the Secrets of an Effective Pricing Strategy appeared first on Tenzo.
]]>Figuring out how to price your restaurant’s menu may seem simple at first, but when you factor in spiralling costs, inflation and consumer outlook, pricing strategy becomes a real challenge.
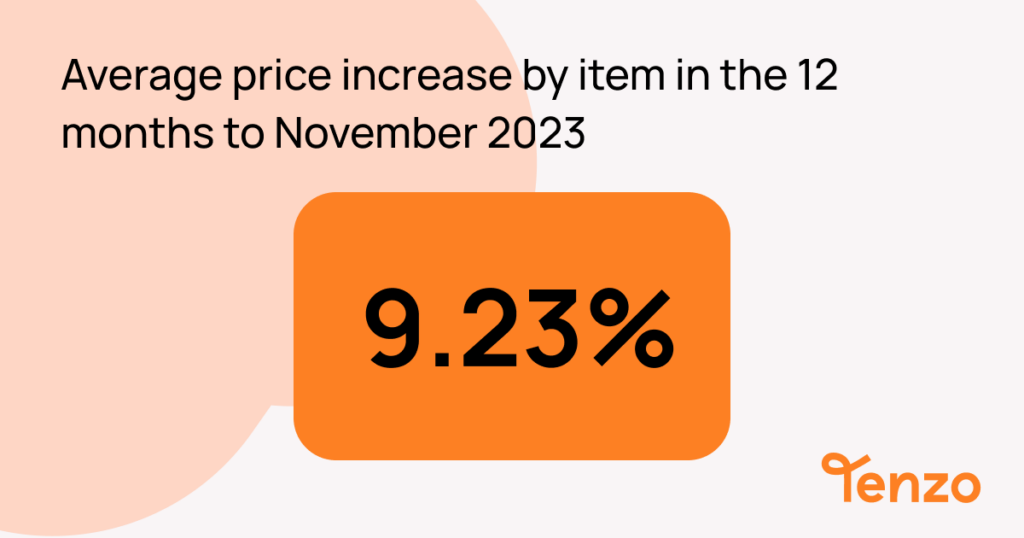
Tenzo recently produced a report looking at how much prices have risen in the last twelve months, and while the overall price increases averaged out at 9.23%, every business has approached their strategy differently.
In a recent webinar, Maddie Pellico, Customer Success Lead at Tenzo, pointed out that ‘instead of raising the whole menu by 10%, Tenzo customers are really focusing on different aspects of that menu, like looking at wet vs dry. We work with a brewery that’s kept their food all at the same cost but has raised their beer prices by about 10%. And we’re seeing the opposite in some other businesses.’
So what are the elements you need to consider when reviewing your pricing strategy?
Menu costing
The first port of call is figuring out exactly how much it costs to produce each menu item. To measure the cost of goods for every menu item in your restaurant, you need to start by calculating the cost of the ingredients used in the dish. This can be done by keeping track of the quantity and price of each ingredient used in a recipe in your inventory management platform.
If you don’t have a platform to automate this, you’ll need to work out the cost of each amount of ingredient that goes into the dish. Eg if a portion of chips requires 200g of potatoes and you buy potatoes at £1 per kilo, then the cost of potatoes for that dish is 20p.
Ideally, your cost of goods should be around 30% to 35% of your revenue although this does depend on the type of restaurant. QSRs will have a lower cost of goods than Fine Dining establishments due to the quality and variety of ingredients needed.
Once you understand exactly how much each item costs to make, you can start looking at pricing strategies to implement.
Understanding Pricing Strategies in Restaurants
Pricing strategy is the method used by restaurants to determine the prices of their menu items. It plays a crucial role in the overall performance of a restaurant, as it directly affects revenue and profitability. By setting the right prices, restaurants can attract customers, cover costs, and generate profits.
There are several potential pricing strategies out there, including:
- Cost-plus
- Triple pricing
- Dynamic pricing
- Promotion-based
Cost-Plus Pricing Strategy
Cost-plus pricing is a straightforward strategy that involves taking your cost of goods, adding your overheads and then adding the appropriate margin for profit.
Overheads would include any other costs incurred while making a dish including fixed costs like rent and electricity as well as other variable costs like labour. The simplest way to calculate your overheads per dish is to take a week’s worth of costs and divide them by the number of dishes you served in that week.
Unfortunately, this does mean that you’re averaging out your variable costs and if this was a week with a lower labour spend then you might underestimate costs. The best way to avoid this is to use a Restaurant PerformanceOps platform to keep track of variable costs like labour so you always know where you stand.
Once you have calculated the cost of making a dish, the advantage of a cost-plus strategy is that it’s simple and you are in complete control of your margins.
The problem is that it doesn’t take any external factors into account. Competition, economic environment and popularity all affect how much customers are willing to pay for items so having a set margin on every dish can be burdensome.
Triple Pricing strategy
Another effective strategy is triple pricing. This involves offering three different price points for customers to choose from. It is also often called the ‘good, better, best’ strategy.
The idea is to have a premium item – ‘best’ – which provides the highest margin, while also having a ‘better’ and ‘good’ option that have slightly lower margins.
A common example is ice cream: one scoop costs £4, two scoops £5, and three scoops £6.
Psychologically, three scoops seem like the best deal because it’s only £2 more expensive than one scoop, but there are also options for more price-sensitive customers.
This strategy can work well for QSRs or Casual Dining businesses that naturally have tiers on their menu (usually sizes or combo options) but is not ideal for fine dining establishments.

Dynamic Pricing Strategy
Dynamic pricing is a hot topic in the industry right now. It’s a strategy that allows restaurants to adjust their prices in real time based on various factors such as demand, time of day, and even weather conditions.
One of the main benefits of dynamic pricing for restaurants is the ability to optimise revenue on a daily basis. By adjusting prices based on demand, restaurants can charge higher prices during peak times when there is high demand, and lower prices during off-peak times to attract more customers.
To successfully implement dynamic pricing, you need to have a real-time view of your sales data as well as accurate forecasts to make pricing decisions – both of which Tenzo can help with.
However, do consider that it can also leave a bad taste in customers’ mouths if they feel they are being overcharged for items they’re used to getting at a lower price point. Just think about how you feel when there’s a significant surge price for an Uber – it’s not always pleasant and can lead to customers finding alternatives that they deem better value.
A great example of dynamic pricing though is Wall Street Wednesdays at The 411 in London: drinks go up and down in price depending on demand – just like the stock market. It’s a fun concept that brings the customer into the action by being totally transparent.
Promotion-based Pricing Strategy
Promotion-based pricing is an approach that involves offering discounts, deals, or promotions to attract customers and increase sales, often used to drive customer traffic during slow periods or to generate buzz around a new menu item.
This type of pricing also allows restaurants to differentiate themselves from competitors and create a sense of urgency among customers. By offering exclusive promotions or discounts, restaurants can make customers feel like they are getting a special deal that they can’t find elsewhere.
This is a common strategy in the QSR game – the hype around celebrity favourite meals at McDonald’s, or the queues for vegan nuggets at KFC prove how successful they can be – but it’s important to factor the promotion into your overall margins by considering how many of your usual guests will opt for a promotion over a full-price item and whether the increase in traffic thanks to the promotion will cover these losses.
When and how to evaluate Pricing Strategies
Unfortunately, the work doesn’t end once you’ve decided on your strategy. Regularly evaluating prices is essential for restaurants to help control rising costs. Prices should be reviewed quarterly as well as when any significant cost increases occur.
According to Sam Benson, Enterprise Implementation Consultant at Tenzo, ‘I’d say prices should be reviewed as a quarterly exercise, but that being said, if there are significant changes in costs, prices need to be considered. For example, if the cost of steak goes up by 20% then it’s time to re-engineer the menu item or increase the price. Another out-of-cycle but relevant time is when the Government Budgets are announced and changes are implemented eg. alcohol duty changes, or minimum wage increases.’
It’s important to analyse your menu as a whole to identify where margins can be increased. Using menu engineering tactics, market research and tracking competitors will all help find efficiencies.
Menu Engineering
Menu engineering is incredibly important when it comes to generating the best margins while still giving customers confidence that they’re getting value.
Use menu item engineering to soften price rises. Blend price increases across the menu to ensure the real price rises actually flow through to your bottom line rather than raising prices on low-volume dishes or causing customers to trade down to cheaper items with a lower margin.
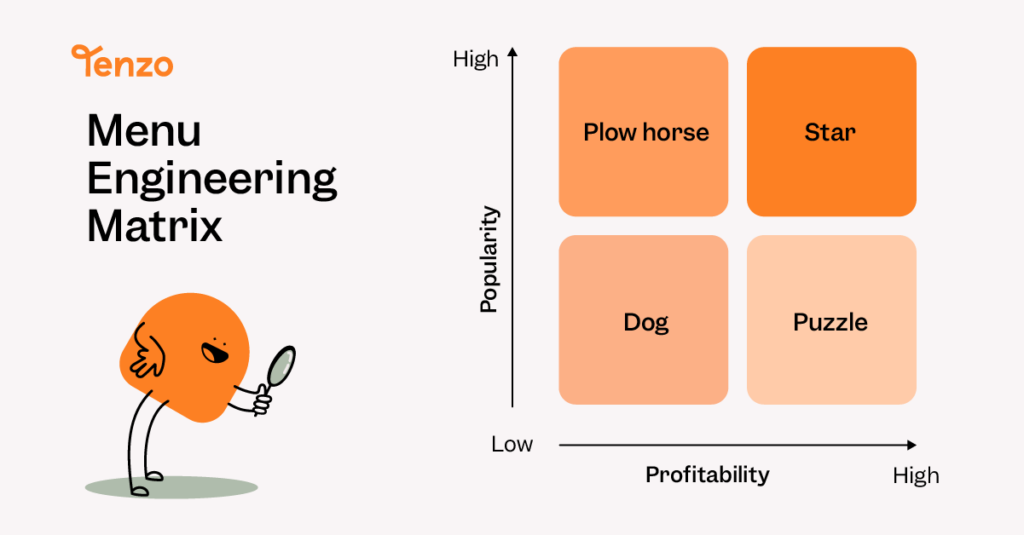
Consider the menu engineering matrix when you do this, evaluating your stars, plow horses, dogs and puzzles to establish where price changes will make the most impact.
Every business is unique, so the areas that will drive margins will differ. We’ve seen some businesses choose to increase the price of their alcoholic drinks as these drive the most revenue, but keep food prices stable. For more food-led businesses, some have increased the price of mains but kept add-on price changes to a minimum, whereas others have taken the opposite approach and only increased prices of sides, appetisers and desserts.
What this shows is that it’s important to dive into your own data to understand where price increases will be tolerated and flow through to your bottom line and where they will potentially put off customers.
Market Research
To understand where your customer sentiment stands, consider conducting market research to identify customer preferences and their willingness to pay.
For example, Tenzo research has revealed that despite the cost of living crisis in the UK, customers have been willing to engage with increased prices. We’ve seen the number of transactions remain constant year-over-year despite a nearly 10% increase in prices.
Industry reports like these will help you understand the general sentiment across the industry, but getting insights on your own customers is most valuable. Consider implementing surveys on your contactless payment or customer experience platforms or tracking mentions on social media to understand your own customers’ feelings toward the value you provide.
This type of market research helps you understand your target market’s willingness to pay by gathering information about their spending habits and price sensitivity. This allows you to set a price that is both competitive and profitable, ensuring that you are not underpricing or overpricing your offering.
Tracking Competitor Pricing
Tracking competitor pricing is key. It allows you to stay competitive and ensure that your prices are in line with what other restaurants in your category are offering. Thankfully, now that all menus are typically available online, you save yourself from making regular rounds of all your competitors like Tenzo co-founder Christian Mouysset did back when he was running Hummus Bros.
‘We always needed to be aware of what our competitors were charging. Being a go-to for lunch, we knew what the other options were charging, whether that was a sandwich from Pret or a salad from Tossed, so that we could be in line with the market, but we also knew our own value and placed a premium on that.’
Tracking competitor pricing helps you identify trends and patterns in the market. Eg if chips are increasing across all your competitors it might be worth considering raising your own prices, although having the lowest-priced chips could also be a competitive advantage for your business if your margins can handle it. This type of differentiation can help you stand out in a crowded market and attract new customers who are looking for better value.
Conclusion
In conclusion, having an effective pricing strategy and reviewing it on a regular basis is crucial for restaurant operators. It allows you to maximise profits, attract customers, and stay competitive in a market faced with rising inflation and constantly increasing costs.
By understanding different pricing strategies and identifying opportunities for price increases, restaurant owners can make informed decisions that benefit their business.
If you’re looking for a tool to help find inefficiencies and optimise the performance of your restaurant business, Tenzo can help. From labour productivity to menu item profitability, we can reveal the areas of your business that need improvement as well as where you’re thriving. Get in touch today to find out more.
The post The Art of Pricing in Restaurants: Unveiling the Secrets of an Effective Pricing Strategy appeared first on Tenzo.
]]>We took a deep dive into Tenzo data to see how prices of individual menu items have changed between November 2022 and today. By analysing a basket of over 60 items that have remained on menus over the last 12 months, we saw an average price increase of 9.23% per menu item. Inflation in the […]
The post How much have restaurant prices risen in the last year? appeared first on Tenzo.
]]>We took a deep dive into Tenzo data to see how prices of individual menu items have changed between November 2022 and today. By analysing a basket of over 60 items that have remained on menus over the last 12 months, we saw an average price increase of 9.23% per menu item.
Inflation in the food and drink space
It’s no secret that over the past year, inflation has been top of mind for restaurateurs. The cost of energy, food and drink rose at such an alarming pace that restaurants had no choice but to invest in revenue-driving actions – the most obvious of which is pricing.
But as the cost of living has risen for general consumers, restaurants have been concerned about increasing prices in line with inflation and spiralling costs for fear of pricing out regular customers. It doesn’t look like those fears have come to fruition though, as the number of transactions across the industry is not dropping.
So, as inflation falls, costs stabilise, and a hint of optimism in the forecasts, we thought we’d take a look at average menu item prices this November compared to November 2022 across a range of businesses and menu categories to see how restaurants have reacted to external pressures over the last 12 months.
How we put our basket together
Tenzo works with hundreds of locations across the globe so has a large amount of data on menu item prices. We pulled this research together by selecting 10 businesses of different sizes and types (bars, casual dining, quick service, fine dining, pubs) and choosing a random selection of dishes and drinks that were sold both in November 2022 and November 2023 and comparing the prices.
What we found was very interesting. There were no consistent increases e.g. where a business had put up prices by a fixed percentage. Every business has a different strategy.
In some examples, prices were raised the most on mains, but sides and drinks remained stable, whereas others only saw large increases in the price of add-ons such as drinks or desserts.
Some prices were increased by over 20%, but others actually decreased. It just goes to show that there are many routes to successfully increasing prices and that every business is unique.
By aggregating all this data, we saw that the average price increase was 9.23% across all businesses and items between November 2022 and November 2023.
How Tenzo’s research compares to other trackers
According to the ONS, the 12-month inflation rate in October 2023 in restaurants and hotels was 7.6%. However, food and non-alcoholic beverages saw the rate fall from 12.2% in September to 10.1% in October. In comparison, the Consumer Prices Index (CPI) only rose by 4.6% in the 12 months to October 2023.
As of publication, Truflation has the current rate of food and beverage inflation at about 8.3% in November, higher than the general rate of 3.89%.
The CGA Prestige Foodservice Price Index, which tracks the wholesale price of food for the industry, has dropped below 20% to 16.7%, the lowest since August 2022, but still far above the current rate of price increases.
What we believe we’re seeing is prices finally catching up with inflation and increased costs. When costs first spiked, businesses were unable to raise their prices at the same rate – the changes had to be more gradual.
What this means for the hospitality industry
With inflation finally slowing, businesses can now plan out their pricing strategies for 2024 rather than having to react to constantly rising costs.
We’re not completely out of the woods yet as the national minimum increases and UK wage inflation remains at 8%, but at least operators can plan for these and include them in their 2024 budgets.
With the most fruitful month of the year about to begin, let’s hope the strains on restaurant businesses are easing and that we’re entering a new era of success.
The post How much have restaurant prices risen in the last year? appeared first on Tenzo.
]]>We’ve been tracking industry numbers in London and the South-East since Covid began. At first, we wanted to keep an eye on how lockdowns were affecting the restaurant industry. Yet, here we are 3 and a half years later still tracking how external factors like the cost of living crisis, energy cost hikes, train strikes, […]
The post A look back on Q3: hospitality industry numbers appeared first on Tenzo.
]]>We’ve been tracking industry numbers in London and the South-East since Covid began. At first, we wanted to keep an eye on how lockdowns were affecting the restaurant industry. Yet, here we are 3 and a half years later still tracking how external factors like the cost of living crisis, energy cost hikes, train strikes, and more are still affecting the industry.
There’s been no shortage of challenges thrown at hospitality, but we continue to see just how resilient this industry is.
Looking at the latest numbers, former operator and Tenzo co-founder Christian Mouysset commented, ‘In January, I don’t think anyone would have believed that we would still be seeing higher sales numbers than last year in Q3. With the cost of living crisis in full swing, we would have expected demand to fall, and yet it has continued to grow. However, the rate of growth is slowing and that could mean we’re in for a difficult Q1 once the festive season subsides.’
Making the most of current demand, closely monitoring costs and eliminating inefficiencies now will make the months to come as successful as possible setting operators up for a better Q1 next year.
To hear more from two former operators, Christian Mouysset and Scot Turner, MD of Auden Hospitality, about the state of the industry and what operators can do to shift from surviving to thriving, join us on October 10th at Hospitality Tech Expo at 1:15 pm.
Like-for-like restaurant sales
We have aggregated sales numbers from several hundred businesses in London and the South-East to see how the third quarter of 2023 compared to 2022.

Across the quarter as a whole, we saw like-for-like sales increase by 7.3%. This was led by August’s 10.4% increase. September was lowest with only a 6.4% rise. Latest inflation numbers are 6.7%, meaning that sales growth was lower than inflation for the first time this year.

Number of transactions grow very slightly
The actual number of transactions rose ever so slightly compared to last year across the quarter with a 2% increase.

Monthly trends remain low with a 3% rise in transactions in July and September and an ever so slightly higher increase in August: 3.7%.

Average transaction value rises
The average transaction value (ATV) has increased 5.7% across the quarter. This is largely due to prices of individual items increasing over the past 12 months to combat increased costs in labour and goods.

While July and August saw a 6.7% and 7% increase respectively, September’s ATV only increased by 3.5%. We saw inflation start to increase by double-digit percentages in September 2022 and so item prices had been increased by this point last year already. Current inflation is 6.7%, so a 3.5% increase does not necessarily keep up, however we may be seeing the price ceiling being hit.

In light of this, operators are going to have to focus on costs in Q4 to keep healthy margins.
Conclusion: what do these numbers mean?
While the numbers continue to grow, compared to Q2 and Q1, growth is slowing. That means that operators will need to focus on costs even more than before, making sure that every restaurant is running as efficiently as possible.
Drilling into your data and understanding where inefficiencies lie is going to be imperative over the coming months.
Hear more from the experts at the Hospitality Tech Expo on October 10th at 1:15 pm, when Christian Mouysset and Scot Turner come together to discuss these numbers and what operators can do.
The post A look back on Q3: hospitality industry numbers appeared first on Tenzo.
]]>At Tenzo, we’re in the business of data – we live and breathe it. We make sure that our customers have the data they need to make the best possible decisions to supercharge their performance. Because of this, we have access to a huge amount of industry data that shows how hospitality as a whole […]
The post What did hospitality sales look like in Q2? appeared first on Tenzo.
]]>At Tenzo, we’re in the business of data – we live and breathe it. We make sure that our customers have the data they need to make the best possible decisions to supercharge their performance. Because of this, we have access to a huge amount of industry data that shows how hospitality as a whole has been performing.
As Q2 comes to a close, we have pulled sales data from hundreds of restaurants in the South-East of the UK to see how the last 3 months have been for hospitality compared to last year.
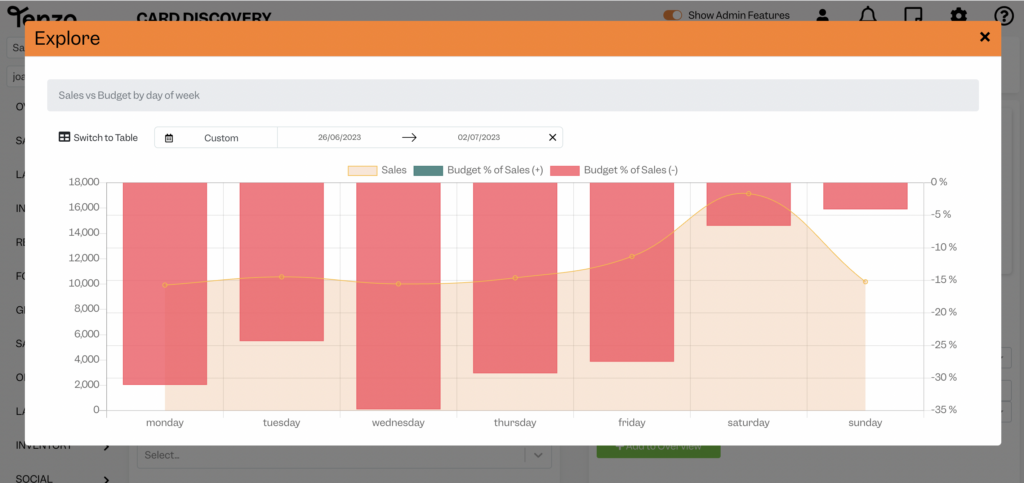
It’s particularly interesting to look at these quarters because of the multitude of Bank holidays, national celebrations and train strikes that occurred throughout and how these outside forces meaningfully impact sales. The graph below shows the quarter at a glance.
(We’re looking at like-for-like days so Monday, June 26th 2023 vs Monday, June 27th 2022 to get the most accurate view of trends. The dates below correspond to 2023’s calendar.)

So here’s a breakdown of the trends we’ve seen in Q2 2023 and how they compare to last year.
Overall sales
At first glance, it does appear that sales are increasing year-on-year – this year’s trend line is consistently above last year’s. However, due to rising inflation and energy price hikes, most businesses have increased their prices. In fact, on average prices have risen by 11% so it would be very surprising if we didn’t see an increase year-over-year in sales numbers.
However, the average increase in sales appears to be 16% so, accounting for the price rises, it looks like sales have increased by 5% since last year. Some good news!
Easter
The first of the many Bank holidays we get in Q2 (at least in 2022 and 2023) is Easter. The shape of the graph remains consistent year-on-year when you consider Easter fell on April 17th in 2022 and April 9th in 2023. We see that sales are slightly increased on Good Friday (vs a non-holiday) as people take advantage of the long weekend. However, the Saturday spike in sales is much lower than average as people go home to visit family or take advantage of the time off to travel.

Bank holidays
We had 3 Bank holidays in May 2023 much to everyone’s delight. But, what did this mean for restaurant sales?

If we look at the first of the three, May Day (May 1st 2023 and May 2nd 2022) we can see what a typical bank holiday looks like – the same pattern repeated in 2022 and 2023. Sales are pulled up not only across the weekend but also on the previous Thursday, showing people like to get the party started early. The Saturday’s peak sales stay in line with other Saturdays, but sales on Sunday and Monday are significantly higher than on non-bank holiday weekends.
We see the same trend in the final bank holiday in May 2023: the spring bank holiday (May 29th 2023) Sales across the end of the week and weekend are higher than they would be in a non-bank holiday week.

Where things start to get interesting is during the other bank holidays that occurred in 2022 and 2023…
National celebrations
By coincidence, we had two national celebrations in May 2022 and 2023: the Queen’s Platinum Jubilee and the King’s Coronation.

These are occasions when the whole country celebrates, so you might have expected hospitality sales to increase during these times. However, this is not the case.
The humble street party replaces a lot of hospitality activities. We saw average sales drop significantly during both the Jubilee and the Coronation so that Saturday spike never occurred. In 2022, there was the added confusion of having a Thursday and Friday (the 2nd and 3rd of June 2022) as holidays rather than the Monday, so by the time Monday rolled around, people were tired of celebrating and the Monday sales were the lowest we saw all quarter.
Charles’s coronation (Saturday, May 6th through Monday, May 8th) giving us the Monday off at least meant that restaurants were able to benefit from higher-than-average Monday sales.
Train strikes
Believe it or not, the first set of train strikes took place during Q2 2022. Unsurprisingly, when both the tubes and the trains were out of action sales took quite a hit. On the first day of strikes in 2022 (Tuesday, June 21st), sales were down 36% compared to what they had been on the previous Tuesday.

We have continued to see that same pattern with the latest strikes, although the effects have lightened over the past year. On Friday, May 12th 2023, sales were down 11% compared to the previous Friday. Where we see the most impact is on weekdays. On Wednesday, May 31st 2023, a strike day, sales were down 26% compared to the previous Wednesday.

Conclusion
Despite the never-ending rises in costs for everyone, the second quarter of 2023 still saw an upward trend in sales. The real issue is lack of consistency: with so many external factors affecting sales (bank holidays, strikes, etc) it was difficult to understand what to expect. What we can see here though is that patterns emerge and if you keep track of these trends year-on-year, you can have a good idea of what’s to come.
The post What did hospitality sales look like in Q2? appeared first on Tenzo.
]]>Restaurant end of day reports can be a pain to do. That’s the cold hard truth. If you’re a restaurant manager, you’ve just finished a long shift, it’s late at night, you want to go home, but instead you have to sit at a computer for half an hour inputting numbers into tiresome spreadsheets. If […]
The post The ultimate daily restaurant report (+ free excel template) appeared first on Tenzo.
]]>Restaurant end of day reports can be a pain to do. That’s the cold hard truth. If you’re a restaurant manager, you’ve just finished a long shift, it’s late at night, you want to go home, but instead you have to sit at a computer for half an hour inputting numbers into tiresome spreadsheets. If you’re in head office, you have to deal with the headache of waking up to potentially dozens of emails and different spreadsheets, which invariably include errors. It’s a nightmare for everyone involved. That’s why we created the ultimate daily restaurant report.
However, these daily reports are a necessity to run a successful F&B business. Having knowledge of how your business is performing on a day-to-day basis, where you’re aware of any issues that arise as they happen, is incredibly important in this ever-changing world. And actually they don’t have to be the bane of every restaurateur’s life.
It’s important to remember, though, that these daily restaurant manager reports need to be simple. It’s not the same set of information that you will have in your weekly or monthly reports, but instead the main operational information for your business.
Looking for a way to automate all your reports? Tenzo sends you the KPIs that matter most to you as often as you want them!
The individual components of a restaurant manager’s daily report
Let’s start with what makes up an ideal end of day or daily restaurant report.
Daily restaurant sales report
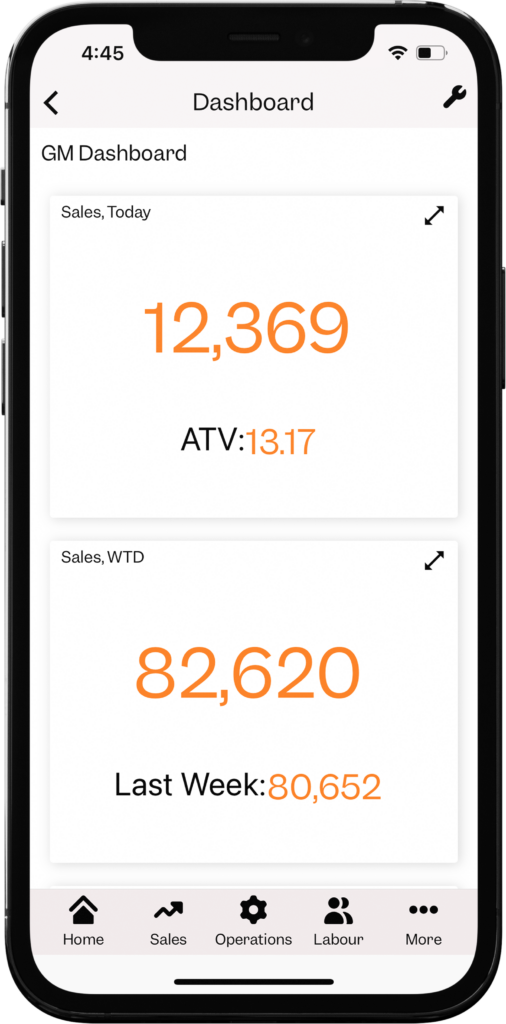
The first thing you’ll want to know is how much revenue you took in for the day. Just having the total number is helpful, but it’s even better if you can see what your revenue looks like in relation to your planned budgets.
A useful element of having daily sales reports is to compare it to the amount you know you need to make to be in the green, after fixed costs like rent, utilities, and salaries come into play. Your budget should reflect that number (it’s especially helpful if that number is dynamic depending on the time of year, day of the week, etc.)
Psstt.. At Tenzo we use your historical data and AI to break down your monthly budgets by day, so that you can achieve realistic targets depending on the day of the week or other factors.
If you want to go even further, getting an idea of when these sales occur could also be helpful. This means separating sales by day part to see how much revenue was taken in at breakfast, lunch and dinner. If you have multiple sales channels, you can also do this for revenue streams such as Delivery, Click & Collect, and Eat-in.
The only other metric you may want to consider is seeing like-for-like performance with the previous year to understand how your operations compare (or perhaps against two years ago if you had a small pandemic disrupt business.)
Daily staffing report
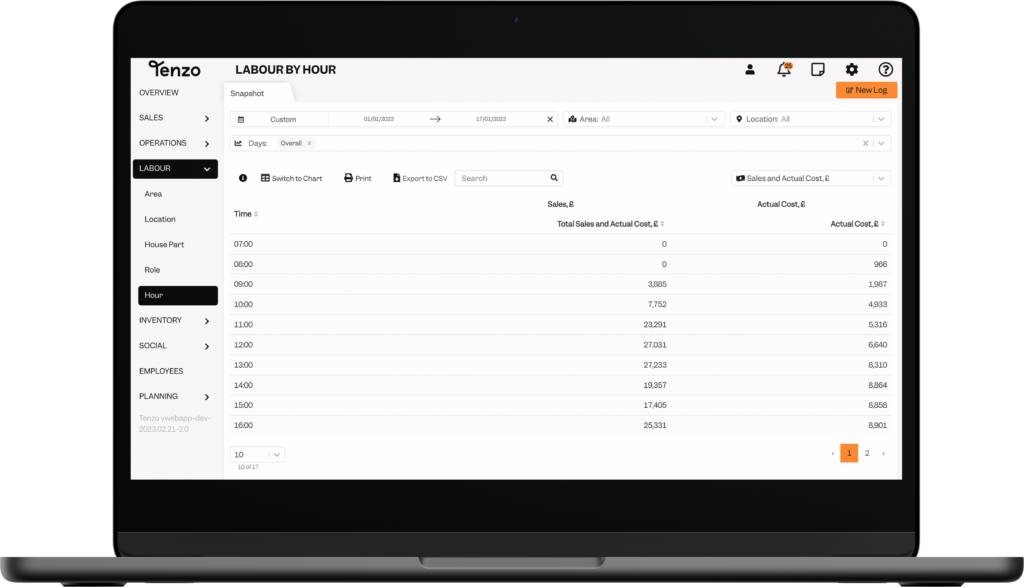
The next thing you’ll want to focus on is your costs. Operationally, you have two major costs: labour/staffing and your cost of goods. The one that has the most effect on a daily basis is your staffing costs as these can fluctuate depending on the day of the week / how busy you are.
There are two different types of labour reports:
- Planned Labour: this is the amount of labour hours you have planned for the day.
- Actual Labour: this is the amount of labour hours that actually took place. This deviation can occur due to no-shows from your team, or from having to send people home early or call people in because you were quieter/busier than expected.
In an ideal world, your planned and actual labour cost would be the same, but this is not usually the case for reasons both in and out of your control. So reporting on actual labour cost as well as what percentage that is of your revenue can be helpful to keep an eye on daily fluctuations.
A note on daily cost of goods reports
As mentioned above, the second of your major operational costs is your goods. It is obviously important to keep track of how much you spend on ingredients to make sure that you are not over-ordering and therefore creating a lot of waste, or under-ordering and therefore running out of certain dishes.
However, unless you have impeccable recipe management where each ingredient is measured to the gram, keeping track of your daily actual cost of goods sold is near impossible.
Therefore, keeping track of your theoretical usage (i.e. sales multiplied by recipes) is a better bet. You can then adjust on a weekly basis as you do your stock counts and see how much variance there is between actual and theoretical.
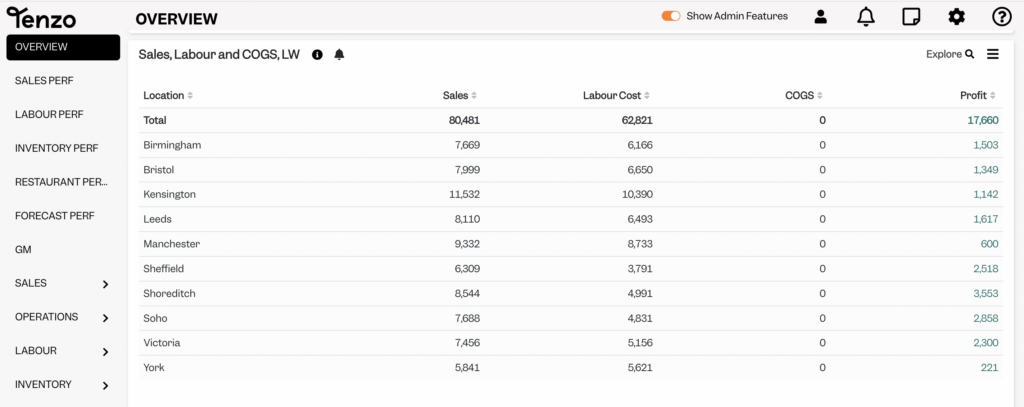
Comparing all of your locations
In a multi-location business, seeing how each of your sites are performing compared to each other is incredibly insightful. You can see the state of the business as a whole instead of in bits and pieces. Plus, you can easily see which locations might need a bit more help or spot anomalies which need your attention.
Daily fluctuations are of course totally normal, but if anything is flagged as out of the ordinary the day of, you’re far more likely to be able to nip any issues in the bud before they become big ongoing problems.
Qualitative elements
Running a restaurant isn’t just about the numbers though. Reporting on maintenance issues, absences, guest relations and the like is just as important and gives you a real overview of the goings-on in the business.
Many of our Tenzo customers use specific daily report templates that are filled in every day so that nothing slips through the cracks. Some have longer templates than others, but across the board these report templates include the basic elements of:
- Front of House and Service
- Back of House and Product
- People
- Guests
- Maintenance
- External factors
- Other comments
Tenzo actually has a feature called ‘logs’ that allows the team to make these comments straight from their phone in the app. That means they can fill it out on their commute home instead of having to stay at the restaurant.
Plus all these logs can be automatically sent to HQ in one report so no more waking up to dozens of emails! You can also search for keywords in past logs so you know when the last time the fridge broke was, who reported it and what location it was in.
The ultimate daily restaurant report
Bring all these elements together and you’ve got the ultimate report! We’ve created an Excel template where you can input all your numbers from your point-of-sale, payroll and inventory system to get your daily overview. It’s got separate worksheets for each of your businesses and you’ll be able to recreate the same format every day.
You can download your free daily restaurant report template as an Excel file here:
If manually inputting all those numbers is too much to bear, have no fear Tenzo is here for you. We integrate with all your different systems (yep, your POS, your labour tool and your inventory tool) and automatically send you the KPIs you need so you never have to worry about a mistyped ‘9’ instead of ‘0’. We then facilitate easy qualitative feedback thanks to our log function. All that information can then be sent to your inbox at 6am on a daily basis!
You can sign up for a demo and we’ll show you exactly how it works!
The post The ultimate daily restaurant report (+ free excel template) appeared first on Tenzo.
]]>During the first week of 2021, Christian (CEO and Co-founder) and Lizzie (Senior Marketing Manager) read the book Play Bigger by Dave Peterson, Al Ramadan, Christopher Lochhead, and Kevin Maney and it set off a catalyst of events that led to this: the creation of a new category, Restaurant PerformanceOps. Time to think The pandemic […]
The post What is Restaurant PerformanceOps? appeared first on Tenzo.
]]>During the first week of 2021, Christian (CEO and Co-founder) and Lizzie (Senior Marketing Manager) read the book Play Bigger by Dave Peterson, Al Ramadan, Christopher Lochhead, and Kevin Maney and it set off a catalyst of events that led to this: the creation of a new category, Restaurant PerformanceOps.
Time to think
The pandemic had given us some time to think about what the ‘new normal’ would mean for restaurants and how Tenzo could best serve our customers. If we were honest with ourselves, we knew that there were 2 key pieces we needed to solve:
- Closing the gap between simply gathering insights and actually acting on them
- Evolving with the industry to help with the shift from surviving to thriving
Christian dreamed up the initial concept for Tenzo as he struggled to actually access his data let alone use it to make real-time decisions when running Hummus Bros, a 6-location chain of restaurants in London.
Having studied computer science with Adam previously, they both knew there had to be a better way of providing insights to restaurateurs.
And so, 7 years ago, accepted into the Tech Stars start-up incubator, Christian and Adam spent a grand total of 5 minutes and 5 dollars on Fiverr for our original logo. Tenzo was born.
At first, the goal was just to bring all operational data into one place, something we achieved and now excel at with over 70 integrations and counting.
Once we’d brought all that data together, we realised we needed to do something with it, so cards and forecasting came to life.
Our dashboards and AI forecasting were loved by head office and our data-savvy users, but we still felt there was value being left on the table: GMs were not getting the information they needed fast enough to make decisions.
That lack of visibility meant opportunities were literally being left on the table. And in such a tight-margined industry, those opportunities can be the difference between success and failure.
That coupled with the huge amount of data restaurateurs now generate and thinner and thinner margins due to rising inflation, labour shortages, and all the other external challenges restaurants are currently facing meant that we knew we had to help restaurants shift from surviving to thriving.
Introducing Restaurant PerformanceOps
Imagine a world where all of your data comes together, in real-time in the palm of your hand.
With a single reporting language: Managers, Operations, Sales, Finance working together as one.
Predicting sales & what that means for labour & inventory. Every Day.
Measuring performance against your KPIs. Every Hour.
Empowering you to act and improve performance. All the Time.
Performance at the centre of what we do
We’re introducing Act, alongside Aggregate and Analyse & Predict to ensure that insights can always be actioned in real-time and meaningfully impact performance.
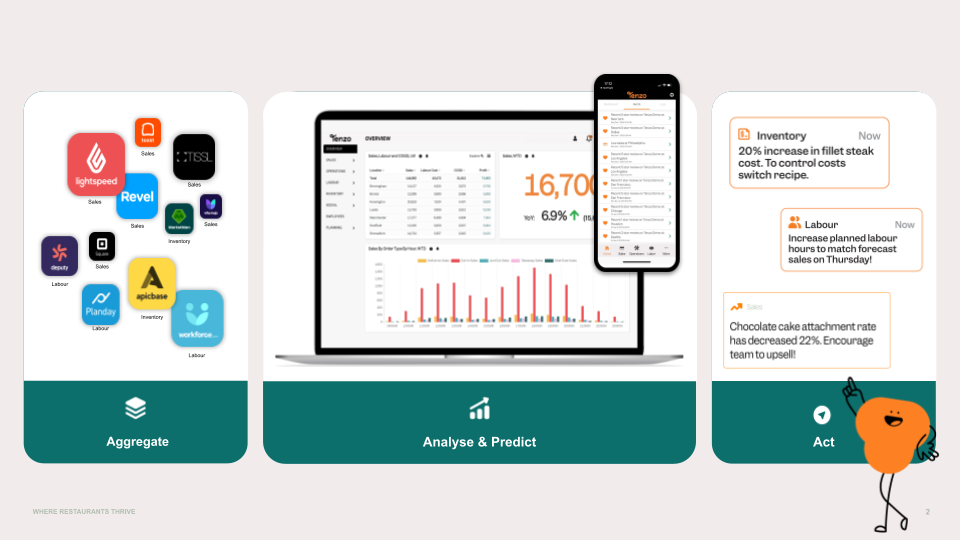
We want to make sure that every lever that can be pulled to optimise performance is pulled and no opportunities are ever left on the table. For happier teams, happier restaurants and a happier planet.
All this to fulfil our ultimate vision: a more sustainable and successful restaurant industry.
The post What is Restaurant PerformanceOps? appeared first on Tenzo.
]]>At Tenzo, we’re all about providing real-time actionable insights from your data. That means getting the top restaurant KPIs that matter most to your business into the hands of the right people to action them at the exact right time. Our method for doing this is what we like to call ‘cards’. Basically they are the […]
The post 8 Top restaurant KPIs Tenzo customers love appeared first on Tenzo.
]]>
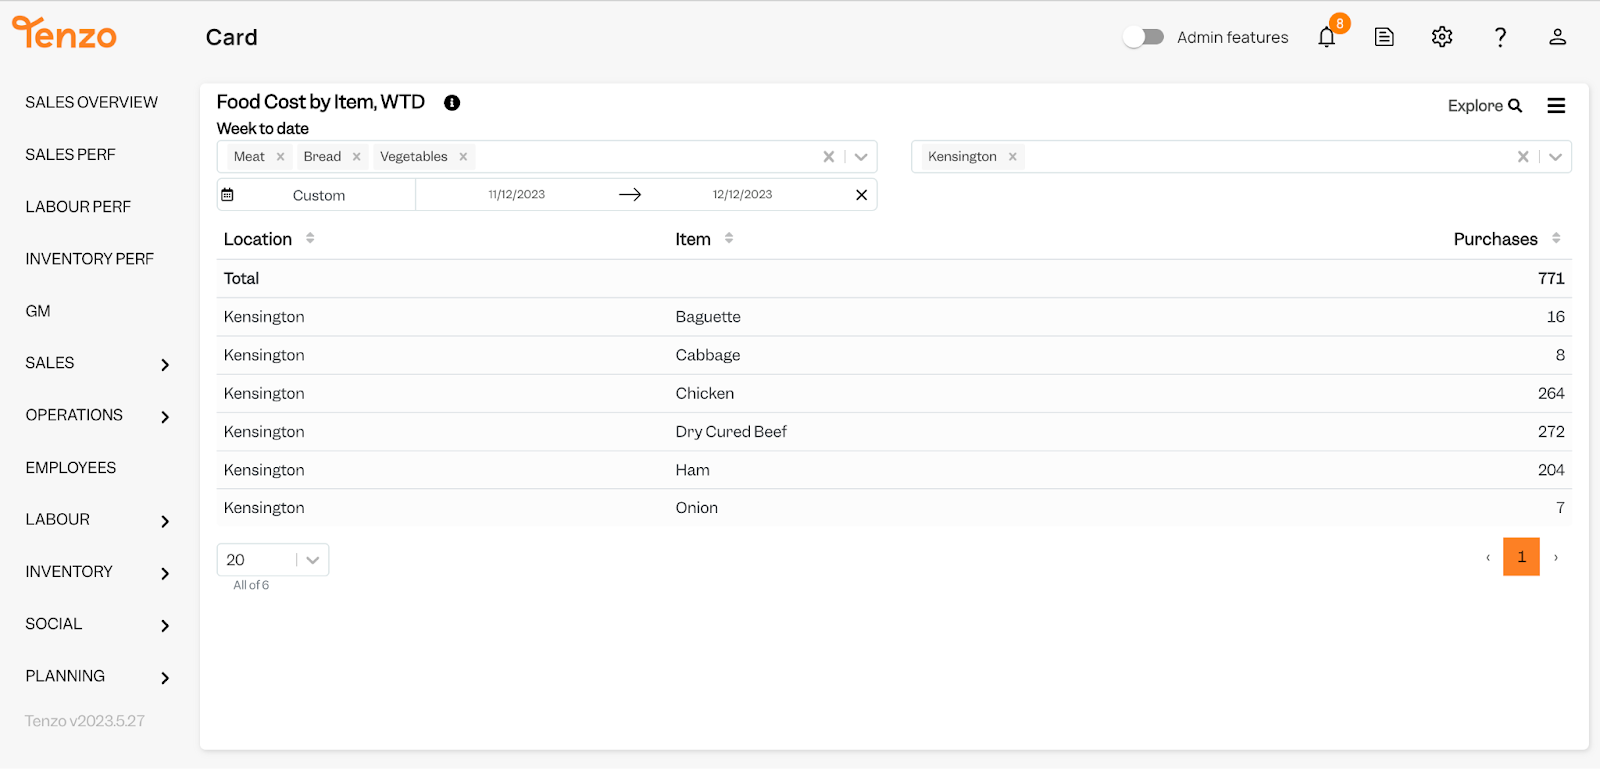
At Tenzo, we’re all about providing real-time actionable insights from your data. That means getting the top restaurant KPIs that matter most to your business into the hands of the right people to action them at the exact right time. Our method for doing this is what we like to call ‘cards’. Basically they are the exact reports you need, automated and accessed by the team members who need them.
We have literally hundreds of cards that Tenzo customers use on a daily basis, but in this article we wanted to highlight the top 8 that we think are most helpful and unique.
Tenzo customers’ top restaurant KPIs and cards
1. Flash P&Ls
The holy grail for restaurant operators. By connecting your labour scheduler, inventory management tool and point of sale to Tenzo, we are able to give you automated instant flash P&Ls and gross profit. That means that you are always aware of how your business is doing – no more waiting till the end of the month to find out you have a problem somewhere, you can action issues immediately.
2. Sales by order type by hour
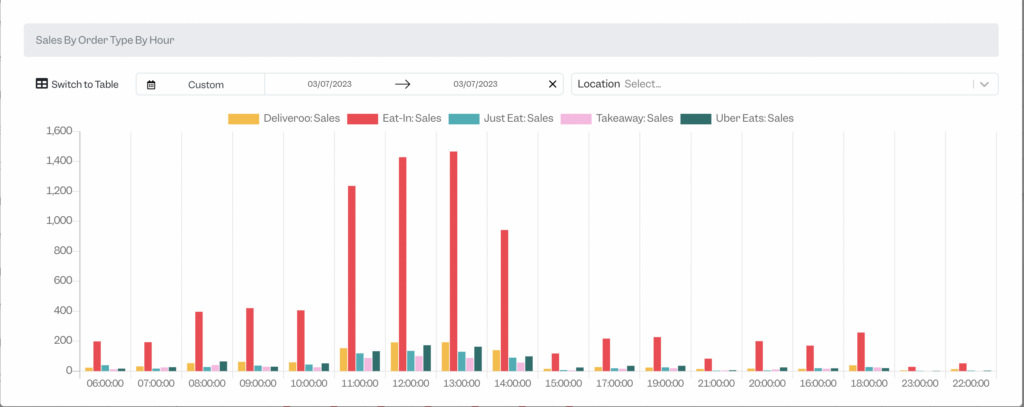
A specifically unique Tenzo card is the sales by hour by order type report. This breaks down your daily sales by hour and then by the type of order that comes in (eat-in, takeaway, delivery). This allows you to understand when certain order types are most popular and when so you can prep and staff accordingly.
3. Average transaction value
Find out your average ticket size for the week to date and in real time and give the team immediate feedback on how well they upsold at lunch, for example.
Plus, understanding where average transaction values are higher or lower can help you run useful marketing campaigns to encourage more items per order or introduce customers to more profitable items.
4. Recent social reviews
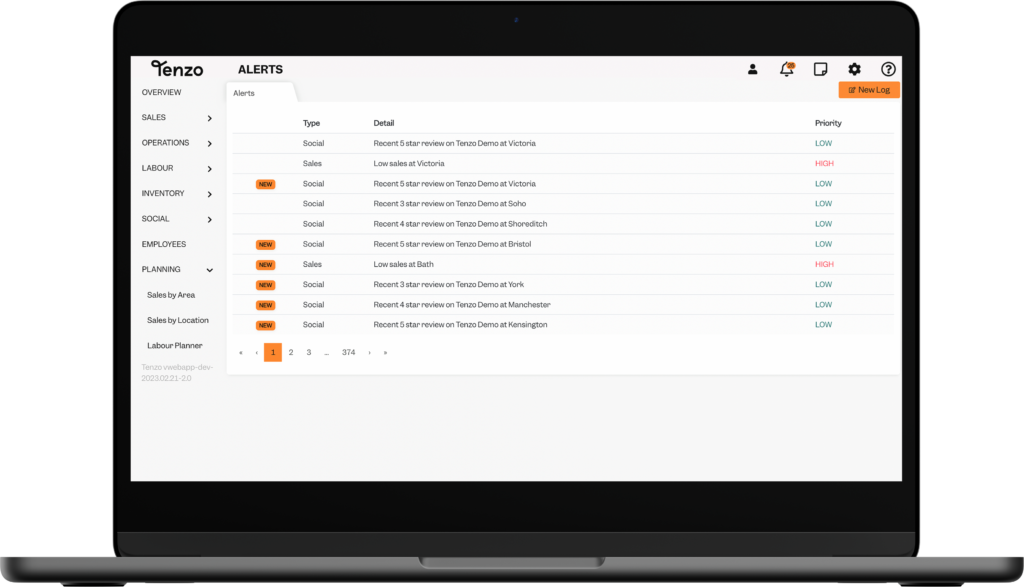
It can be a real headache keeping up with social reviews on the plethora of platforms where submissions are possible. But with this card, you can keep track of all reviews for all locations in one place. We can even alert your GM any time a negative review comes in so it can be actioned immediately, not whenever they next log in to that specific platform.
5. Revenue by group size
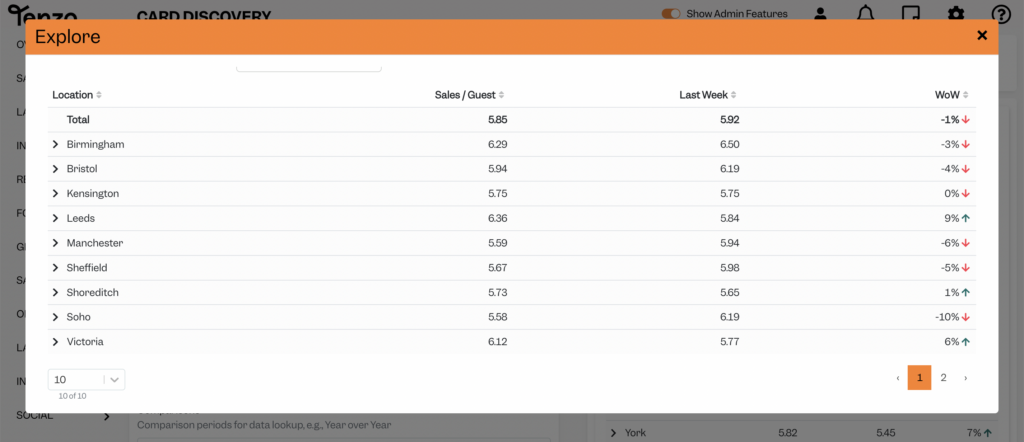
For larger eat-in establishments, knowing your spend per guest by group size can help optimise your table size and arrangements. For example, if you know that when a group of 6 comes in, the average spend per head is higher than a couple’s, then having more 6-tops available to book may raise overall revenue.
6. Forecast accuracy
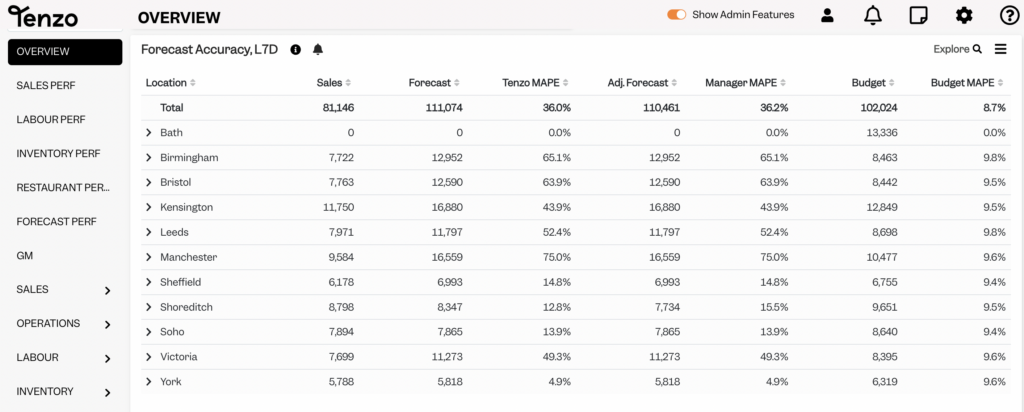
Tenzo allows you to upload your own budgets (i.e. what you expect to take in), but we also forecast your future sales. You can easily keep track of how well actual sales are performing against your budgets and Tenzo’s forecasts with this card.
7. Actual vs theoretical usage
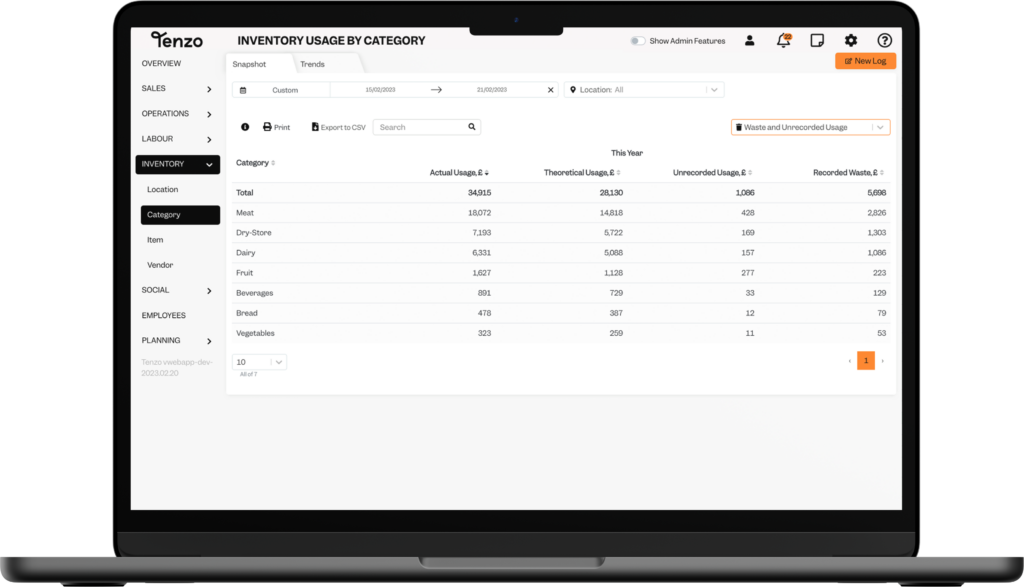
Thanks to an integration with your inventory system, this card allows you to see the difference between your actual and theoretical usage. Being aware of this number helps you focus on reducing your food waste, saving both money and the planet!
This is just a scant collection of the cards we have. If you’re a Tenzo customer and you’d like to add one of these cards to your dashboard, don’t hesitate to get in touch with your Customer Success Manager. If you’re not yet familiar with the Tenzo platform and you’d like to find out more, contact us here for a free demo.

The post 8 Top restaurant KPIs Tenzo customers love appeared first on Tenzo.
]]>According to a report from the Food and Agricultural Organisation (FAO), global food wastage per year is approximately 1.3 billion tonnes, which is roughly a third of the food produced in the world for human consumption. On a more local scale, waste in UK restaurants is approximately 1.6 million tonnes per year with around 600,000 tonnes of this […]
The post Reducing Food Waste | Strategies to help boost restaurant performance appeared first on Tenzo.
]]>According to a report from the Food and Agricultural Organisation (FAO), global food wastage per year is approximately 1.3 billion tonnes, which is roughly a third of the food produced in the world for human consumption. On a more local scale, waste in UK restaurants is approximately 1.6 million tonnes per year with around 600,000 tonnes of this being food. Breaking this down: 30% is from plate waste (customer leftovers); 5% from spoilage; 65% from prep waste (food not used after preparation). Reducing food waste is vital to boost restaurant performance and control costs.
Why exactly is this such a problem? Firstly, global population is on the increase with 10 billion people expected by around 2050. Therefore demand will be significant and without an increase in supply prices will rise. Added to this, climate change has the potential to create further difficulties in food production as extreme weather events such as droughts and floods will lower crop yields. Together, these issues could have disastrous consequences on food security leaving millions starving.Attempting to address this problem may seem daunting however, there are strategies restaurants can implement to contribute to reducing food waste.
Best strategies for reducing food waste
1. Utilise preparation waste for the creation of other menu items.
For example, SiloLondon utilises broccoli cores in the creation of one of its dishes.
2) Offer a greater range of portion sizes or encourage the use of doggy bags for your customers.
3) Calculate and monitor your ‘actual wastage’ with the help of vigilant stocktaking.
For example, by connecting menu items with their ingredients i.e. the cheeseburger needs 1 beef patty, 2 buns, a slice of cheese and pickle etc. When you take the dishes sold and multiply this by the recipes of each menu item you get the “theoretical usage”. When you do the stock count you can work out the “actual usage”. Minus the “theoretical usage” from the “actual usage” and you get “actual wastage”.
For simplicity:
Theoretical usage = Total dishes sold x individual recipe items
Actual usage = Ordered food items — remaining food items
Actual wastage = Actual usage — theoretical usage
The difference between the theoretical usage and actual usage will typically come down to:
- Portion sizes being bigger/smaller than defined in the recipe. More training of the kitchen team can help improve this.
- Items that are free and therefore not entered in the till (eg: staff meals or deliveries from third parties). To be able to identify the cause of the waste, it’s important to make sure that these are entered in the till and discounted to zero so that they are counted as part of the theoretical usage.
4) Buy and prep the right amount of food each day.
This may seem like an obvious point to make but it is actually a very difficult task to get right. This is because there are a large number of variables which will affect your sales for any given day for example seasonal variations, overall growth trends as well as local weather and events.
Technologies are now available to accurately forecast sales, from the store level right down to the individual item level taking into account the previously mentioned variables. Tenzo has this capability by utilising cutting edge machine learning algorithms (or artificial intelligence). This technology has a proven track record of reducing food waste. Click here for more information and if you’re interested in a demo you can sign up here.
At an individual level these contributions are quite small, however, collectively (across all restaurants) they are huge and can have a significant effect on food prices and sustainability. For inspiration, here is a list of the most sustainable restaurants in the UK. Have a look — you may get some great ideas!
To learn more about reducing your restaurants’ food waste visit the Too Good to Waste Campaign run by the Sustainable Restaurant Association.
The post Reducing Food Waste | Strategies to help boost restaurant performance appeared first on Tenzo.
]]>Data is a gold mine of insights, which can dramatically add value to your business across the board and give a significant competitive advantage. But how is it that most businesses fail to use their own data (sales, reviews, etc) and miss out on the opportunity to gain insights, make better decisions and ultimately grow? […]
The post Using data as a competitive advantage for your restaurant appeared first on Tenzo.
]]>Data is a gold mine of insights, which can dramatically add value to your business across the board and give a significant competitive advantage. But how is it that most businesses fail to use their own data (sales, reviews, etc) and miss out on the opportunity to gain insights, make better decisions and ultimately grow?
The aim of this article is to show you that clear data will always triumph over ‘gut’ led decision making. Businesses that use their data properly will always have a competitive edge as they can react faster, forecast better and gain real insight about their business activity.
Four benefits of using data for a competitive advantage in your business.
1. Use social data to increase sales
Did you know that one star social media rating has been shown to drive 7% of additional revenue? By continuously monitoring the data from customer reviews on social sites like Yelp, Google Places, Facebook, Tripadvisor, getting alerted of bad reviews and reacting quickly, you will have a direct impact on sales.
Furthermore, focus on using your social data to raise your customer loyalty and engage more new customers instantly.

2. Use data to reduce your COGS
Data can add value by helping you accurately forecast your future sales. By analysing many factors such as weather, events and past sales performance it is possible to get an accurate forecast which in turn can help you adjust staffing levels, optimise opening hours and reduce wastage.
3. Data will highlight your top staff performers
In hospitality, there is a massive variability in staff performance — 150% variability in check size dependent on employee and a staggering 800% in speed of service. Analysing transactional data can help identify the top performers, ensuring that the best staff are scheduled at the right place at the right time.
4. Data will train better staff
By showing your front line team members data on average customer spend and speed of service you can train staff to perform to a higher level. Data analytics can help you give employees real time feedback on their performance. Furthermore, incentivising staff to outperform the benchmark, will increase sales.
In conclusion, the more data you collect from customers, from your sales and from your employees, the more actionable insights you will receive, which will significantly add value to your business. Developing a data analytics capability by using the best tools such as Tenzo is essential.
Tenzo is a platform that gives hospitality and retail businesses actionable insights from their real time data.

The post Using data as a competitive advantage for your restaurant appeared first on Tenzo.
]]>